You have skipped the navigation, tab for page content
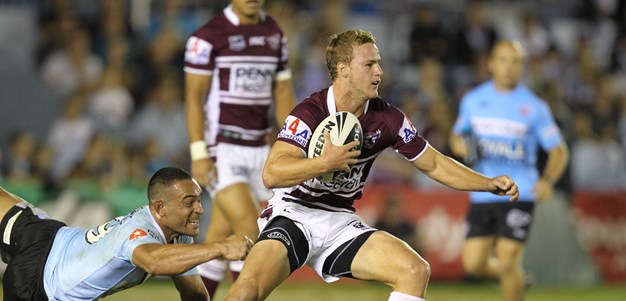
Daly Cherry-Evans Profile Image

Daly Cherry-Evans

Captain - Halfback

Sea Eagles

Player Bio

Height:
183 cm
Date of Birth:
20 February 1989
Weight:
85 kg
Birthplace:
Redcliffe, QLD
Age:
35
Nickname:
Chez
Debut Club:
Manly-Warringah Sea Eagles
Date:
12 March 2011
Opposition:
Melbourne Storm
Round:
1
Previous Club:
Nil
Junior Club:
Mackay Brothers
Biography:

Inspirational Sea Eagles half-back and captain Daly Cherry-Evans is the most capped Manly player of all time.

A premiership winner in his first season at Manly in 2011, Cherry-Evans won the Clive Churchill Medal in 2013.

He is also a three-time winner of the Club’s NRL Roy Bull 'Best and Fairest' Award (2017, '20, '23).

A big game player with a lethal all-round kicking game and a proven big match winner, Cherry-Evans also holds the record for most field goals in the NRL era since 1988 with 28.

Cherry-Evans became the first half-back to reach 300 games in the same position. He is the 49th player in the game's history to play 300 games.

On the representative front, Cherry-Evans has played 25 Origin games for Queensland and has captained the Maroons on 18 occasions to three series victories (2020, 2022, 2023).

He has also played 21 Tests for Australia since 2011.

Cherry-Evans is contracted to Manly to the end of 2025.

Career

Appearances
329
Tries
93

2024 Season

Appearances
24

Scoring

Tries
8
Goals
16

Kicking

Forced Drop Outs
21
Average Kicking Metres
410.7
Goal Conversion Rate

Attack

Try Assists
17
Line Break Assists
19

Passing

Offloads
13
Receipts
1610

Defence

Tackles Made
437
Tackle Efficiency

Running Metres

Average Running Metres
76
Total Running Metres
1827

Fantasy

Total Points
1269
Average Points
52.9

2024 Season - By Round

Round Opponent Score Position Minutes Played Tries Goals 1 Point Field Goals 2 Point Field Goals Points Kicking Metres Forced Drop Outs Try Assists Linebreaks Tackle Breaks Post Contact Metres Offloads Receipts Tackles Made Missed Tackles Total Running Metres Hit Up Running Metres Kick Return Metres
1 Rabbitohs Won 36 - 24 Halfback 80 - - - - - 379 1 1 - 2 9 1 72 18 1 125 - -
2 Roosters Won 21 - 14 Halfback 80 - - 1 - 1 311 - - - 3 16 1 66 12 1 86 - -
3 Eels Lost 28 - 24 Halfback 80 - - - - - 310 1 - - 2 16 1 59 11 1 48 - -
4 Dragons Lost 20 - 12 Halfback 80 - - - - - 229 3 - - 2 19 1 69 29 4 85 10 -
5 Panthers Won 32 - 18 Halfback 80 1 6 - - 16 594 3 1 - 1 7 - 68 21 4 90 - -
6 Warriors Drawn 22 - 22 Halfback 90 2 3 - - 14 693 2 1 - 3 18 - 58 21 3 46 - 2
7 Titans Won 30 - 34 Halfback 80 - - - - - 557 - - - 1 8 - 55 17 3 32 - -
8 Eels Won 32 - 18 Halfback 80 1 - - - 4 241 - 1 - 4 7 - 65 12 1 89 - -
9 Raiders Lost 24 - 26 Halfback 80 1 - - - 4 296 - 1 - 3 21 1 57 17 1 79 - -
10 Dolphins Lost 30 - 24 Halfback 80 - - - - - 492 1 - - 3 11 1 65 16 1 64 14 -
11 Broncos Lost 12 - 13 Halfback 80 - - - - - 419 - - - 4 30 1 82 21 1 93 - -
12 Storm Won 26 - 20 Halfback 80 - - - - - 294 1 1 - 1 14 - 76 22 1 106 10 -
14 Panthers Lost 32 - 22 Halfback 80 - - - - - 535 - - - - 11 - 78 12 4 65 - 1
15 Dragons Won 30 - 14 Halfback 80 - 3 - - 6 455 2 3 1 1 5 1 76 23 5 117 - -
18 Cowboys Won 20 - 21 Halfback 84 - - 1 - 1 496 - 1 - 1 11 - 87 24 2 127 - -
20 Titans Won 38 - 8 Halfback 80 - - - - - 279 3 - - 3 3 - 63 18 4 65 - -
21 Roosters Lost 34 - 30 Halfback 80 1 4 - - 12 621 2 - - 1 8 1 85 15 2 177 12 -
23 Raiders Won 24 - 46 Halfback 80 1 - - - 4 225 - 1 1 5 7 - 52 11 2 75 - -
24 Warriors Won 24 - 10 Halfback 80 - - - - - 245 - 1 - 2 4 1 60 25 - 35 - -
25 Wests Tigers Lost 34 - 26 Halfback 80 - - - - - 269 1 - - 1 6 - 52 17 3 45 - -
26 Bulldogs Won 22 - 34 Halfback 80 - - - - - 601 1 1 - 1 13 - 68 18 1 34 - -
27 Sharks Lost 20 - 40 Halfback 80 - - - - - 526 - 1 - 1 7 - 69 21 3 23 - -
28 Bulldogs Won 22 - 24 Halfback 80 1 - - - 4 538 - 1 1 2 22 1 76 11 - 64 - -
29 Roosters Lost 40 - 16 Halfback 80 - - - - - 254 - 2 - - 5 2 52 25 6 48 - -

Career By Season

Career By Season
Year Played Won Lost Drawn Win % Tries Goals 1 Point Field Goals 2 Point Field Goals Points Kicking Metres Kicking Metres Average Goal Conversion Rate Forced Drop Outs Try Assists Offloads Receipts Tackles Made Missed Tackles Tackle Efficiency Total Running Metres Average Running Metres Kick Return Metres Total Points Average Points
Sea Eagles 2011 27 21 6 - 78% 7 25 - - 81 10,206 377.99 62.50% - 19 30 57 644 84 84.50% 1,556 57.00 109 - -
Sea Eagles 2012 27 17 10 - 63% 7 3 - - 35 9,604 355.70 50.00% - 15 29 - 578 68 89.47% 1,462 54.00 19 - -
Sea Eagles 2013 27 16 10 1 59% 11 - - - 46 8,298 307.33 - 15 15 35 1,245 631 50 90.33% 1,650 61.00 41 1,612 59.7
Sea Eagles 2014 23 15 8 - 65% 3 - - - 16 6,918 300.77 - 10 11 40 982 481 46 88.09% 1,368 59.00 75 1,142 49.6
Sea Eagles 2015 23 11 12 - 48% 4 - - - 16 7,681 333.97 - 16 18 21 1,011 524 37 93.40% 1,351 58.00 23 1,293 56.2
Sea Eagles 2016 19 7 12 - 37% 5 - - - 22 5,531 291.12 - 11 16 17 1,042 411 39 88.93% 1,138 59.00 1 950 50.0
Sea Eagles 2017 25 14 11 - 56% 6 9 - - 46 5,589 223.55 81.82% 19 19 14 1,029 584 66 89.85% 1,446 57.00 54 1,226 49.0
Sea Eagles 2018 24 7 17 - 29% 8 65 1 - 164 6,204 258.51 78.31% 13 15 16 1,215 443 56 88.78% 1,539 64.00 25 1,316 54.8
Sea Eagles 2019 21 13 8 - 62% 5 21 2 - 64 7,096 337.90 80.77% 15 21 21 1,108 381 35 91.59% 1,365 65.00 24 1,223 58.2
Sea Eagles 2020 20 7 13 - 35% 6 12 1 - 49 8,356 417.78 75.00% 11 20 17 1,243 348 44 88.78% 1,514 75.00 21 1,288 64.4
Sea Eagles 2021 25 16 9 - 64% 9 1 2 - 40 9,660 386.42 50.00% 16 27 36 1,338 536 49 91.62% 2,147 85.00 34 1,742 69.7
Sea Eagles 2022 22 7 15 - 32% 5 15 2 - 52 9,740 442.73 71.43% 24 18 23 1,275 471 45 91.28% 1,642 74.00 49 1,310 59.6
Sea Eagles 2023 22 11 10 1 50% 9 20 1 - 77 10,258 466.28 76.92% 16 18 20 1,455 414 35 92.20% 1,942 88.00 50 1,402 63.7
Sea Eagles 2024 24 13 10 1 54% 8 16 2 - 66 9,857 410.72 80.00% 21 17 13 1,610 437 54 89.00% 1,827 76.00 4 1,269 52.9

Career Overall

Career Overall
Year Start Year End Played Won Lost Drawn Win % Tries Goals 1 Point Field Goals 2 Point Field Goals Points Kicking Metres Kicking Metres Average Goal Conversion Rate Forced Drop Outs Try Assists Offloads Receipts Tackles Made Missed Tackles Tackle Efficiency Total Running Metres Average Running Metres Kick Return Metres Total Points Average Points
Sea Eagles 2011 2024 329 175 151 3 53% 93 187 11 - 774 114,937 349.35 73.05% 187 249 332 14,604 6,880 708 90.67% 21,930 66.00 531 15,754 57.3

Latest

Team Mates

Acknowledgement of Country

Manly Warringah Sea Eagles respect and honour the Traditional Custodians of the land and pay our respects to their Elders past, present and future. We acknowledge the stories, traditions and living cultures of Aboriginal and Torres Strait Islander peoples on the lands we meet, gather and play on.

Major Partner

Premier Partners

Senior Partners

View All Partners